

With all the media coverage of the opioid epidemic over the last few years, here’s something you might not know: The amount of opioid painkillers being prescribed in the United States is actually going down. According to the CDC, that number peaked in 2010 at 782 morphine milligram equivalents (or MMEs) per capita and fell to 640 MME per capita in 2015. The CDC speculates that the decrease “might reflect growing awareness among clinicians and patients of the risks associated with opioids.”
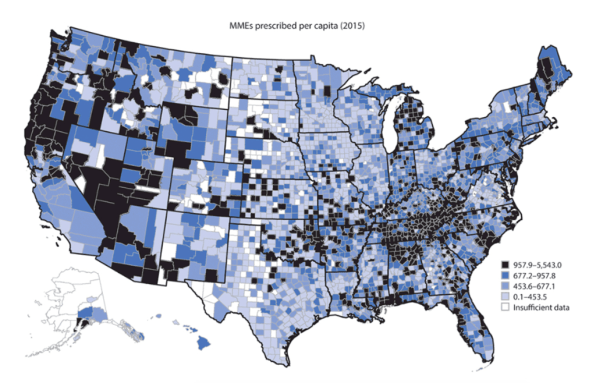
However, the opioid prescription rate is not evenly distributed. As the map below shows, large swaths of the country had significantly higher rates of opioid prescriptions per capita in 2015, with particular hot spots being Northern California, Southern Nevada, Western Maine, and Tennessee. (A second map here shows which counties saw a decrease between 2010 and 2015.) The CDC says higher amounts of opioids tend to be prescribed in counties with a higher prevalence of diabetes and arthritis. The CDC discussed the findings in a “Vital Signs” report published on Friday. Check out the full report here.