STORY HIGHLIGHTS
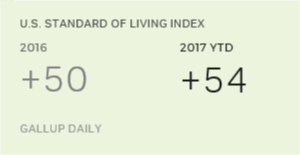
- Index stands at +54 for the year, well above 2016’s record-high +50
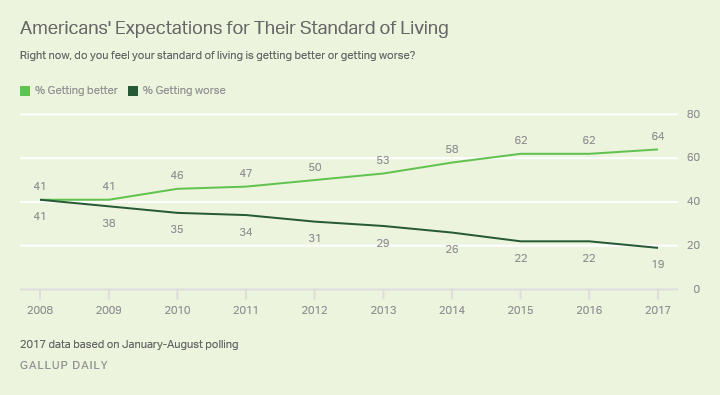
- Almost two-thirds now say standard of living is getting better
- Republicans’ rising expectations driving this year’s index improvement
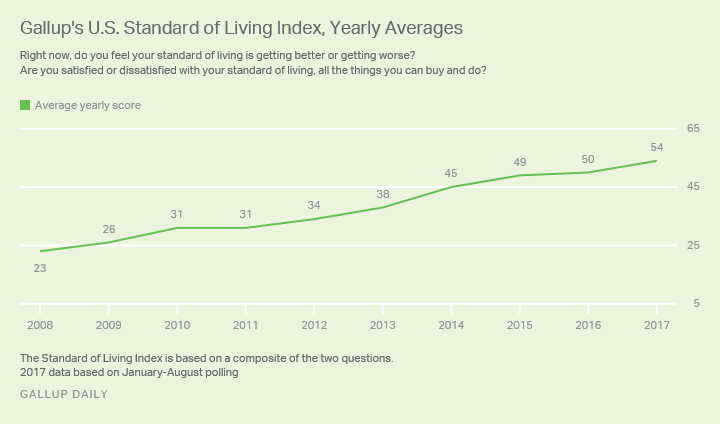
WASHINGTON, D.C. — Americans’ ratings of their standard of living are on pace to be the best in Gallup’s 10-year tracking history. The index average for the year now stands at +54 — four points above last year’s record-high +50.
On a monthly basis, Americans’ perceptions of their standard of living have been particularly strong in the past two months, with the index averaging +56 in July and +55 in August. In the first half of the year, monthly readings varied between +51 and +54.
The index was created in 2008 during the 2007-2009 Great Recession, helping explain why it has followed a generally upward path in the years since, as the U.S. economy gradually has recovered. The index is a composite of answers to two questions: how satisfied Americans are with their current standard of living and whether they think their standard of living is getting better or getting worse — with “staying the same” a volunteered option.
This year’s rise in the overall index is driven by an increase in Americans’ outlook for their standard of living. The percentage of Americans saying their standard of living is getting better has risen from 62% in 2016 to 64% so far this year, with a corresponding drop in the percentage saying it is getting worse, from 22% to 19%. The strongly positive expectations Americans now have for their standard of living is a far cry from the situation in 2008, when as many thought their situation was getting worse as thought it was improving.

Satisfaction With Current Standard of Living Holds Steady
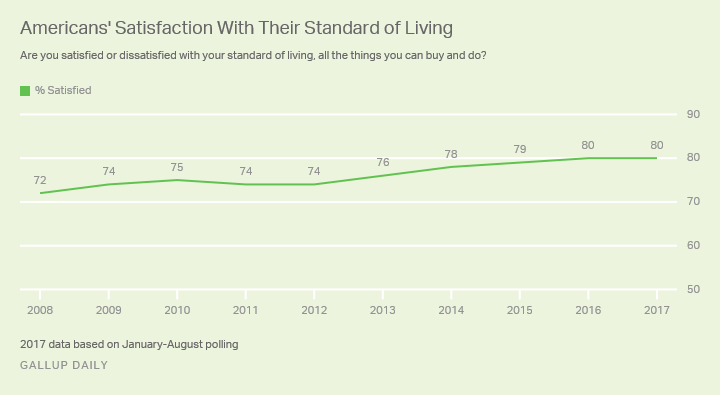
Americans’ level of satisfaction with their current standard of living has been more stable than the measure of whether it is getting better or getting worse. At present, 80% say they are satisfied, the same percentage as in 2016. U.S. adults have been overwhelmingly positive in assessing their satisfaction with their own standard of living throughout the history of the question. Even in the tough economic times of 2008 and 2009, almost three-fourths of Americans were satisfied.

Republicans, Those 50 and Older Most Likely to See Improvement
With the January changeover from Barack Obama’s Democratic administration to Donald Trump’s Republican presidency, 68% of Republicans (including independents who lean Republican) in 2017 say their standard of living is getting better, up from 56% last year. Among Democrats, 62% to date in 2017 say it is getting better, down slightly from 68% last year.

Gallup Analytics
Subscribe to our online platform and access nearly a century of primary data.
Age is also a factor: Those aged 50 and older are more likely this year than in 2016 to say their standard of living is improving, while there is little change among those younger than 50.
Americans of all income levels are slightly more likely to think their standard of living is getting better.
| 2016 | 2017 | |||||||||||||||||||||||||||||||||||||||||||||||||||||||||||||||||||||||||||||||||||||||||||||||||||
|---|---|---|---|---|---|---|---|---|---|---|---|---|---|---|---|---|---|---|---|---|---|---|---|---|---|---|---|---|---|---|---|---|---|---|---|---|---|---|---|---|---|---|---|---|---|---|---|---|---|---|---|---|---|---|---|---|---|---|---|---|---|---|---|---|---|---|---|---|---|---|---|---|---|---|---|---|---|---|---|---|---|---|---|---|---|---|---|---|---|---|---|---|---|---|---|---|---|---|---|---|
| % | % | |||||||||||||||||||||||||||||||||||||||||||||||||||||||||||||||||||||||||||||||||||||||||||||||||||
| U.S. adults | 62 | 64 | ||||||||||||||||||||||||||||||||||||||||||||||||||||||||||||||||||||||||||||||||||||||||||||||||||
| Annual household income | ||||||||||||||||||||||||||||||||||||||||||||||||||||||||||||||||||||||||||||||||||||||||||||||||||||
| <$24,000 | 55 | 56 | ||||||||||||||||||||||||||||||||||||||||||||||||||||||||||||||||||||||||||||||||||||||||||||||||||
| $24,000-$59,999 | 60 | 62 | ||||||||||||||||||||||||||||||||||||||||||||||||||||||||||||||||||||||||||||||||||||||||||||||||||
| $60,000-$89,999 | 64 | 66 | ||||||||||||||||||||||||||||||||||||||||||||||||||||||||||||||||||||||||||||||||||||||||||||||||||
| $90,000+ | 70 | 72 | ||||||||||||||||||||||||||||||||||||||||||||||||||||||||||||||||||||||||||||||||||||||||||||||||||
| Age | ||||||||||||||||||||||||||||||||||||||||||||||||||||||||||||||||||||||||||||||||||||||||||||||||||||
| 18-29 | 86 | 83 | ||||||||||||||||||||||||||||||||||||||||||||||||||||||||||||||||||||||||||||||||||||||||||||||||||
| 30-49 | 72 | 73 | ||||||||||||||||||||||||||||||||||||||||||||||||||||||||||||||||||||||||||||||||||||||||||||||||||
| 50-64 | 51 | 57 | ||||||||||||||||||||||||||||||||||||||||||||||||||||||||||||||||||||||||||||||||||||||||||||||||||
| 65+ | 36 | 41 | ||||||||||||||||||||||||||||||||||||||||||||||||||||||||||||||||||||||||||||||||||||||||||||||||||
| Party | ||||||||||||||||||||||||||||||||||||||||||||||||||||||||||||||||||||||||||||||||||||||||||||||||||||
| Republicans/Leaners | 56 | 68 | ||||||||||||||||||||||||||||||||||||||||||||||||||||||||||||||||||||||||||||||||||||||||||||||||||
| Democrats/Leaners | 68 | 62 | ||||||||||||||||||||||||||||||||||||||||||||||||||||||||||||||||||||||||||||||||||||||||||||||||||
| Race/Ethnicity | ||||||||||||||||||||||||||||||||||||||||||||||||||||||||||||||||||||||||||||||||||||||||||||||||||||
| Non-Hispanic whites | 57 | 61 | ||||||||||||||||||||||||||||||||||||||||||||||||||||||||||||||||||||||||||||||||||||||||||||||||||
| Blacks | 73 | 68 | ||||||||||||||||||||||||||||||||||||||||||||||||||||||||||||||||||||||||||||||||||||||||||||||||||
| Hispanics | 76 | 75 | ||||||||||||||||||||||||||||||||||||||||||||||||||||||||||||||||||||||||||||||||||||||||||||||||||
| 2017 data based on January-August polling | ||||||||||||||||||||||||||||||||||||||||||||||||||||||||||||||||||||||||||||||||||||||||||||||||||||
| GALLUP DAILY | ||||||||||||||||||||||||||||||||||||||||||||||||||||||||||||||||||||||||||||||||||||||||||||||||||||
Non-Hispanic whites are slightly more likely now than in 2016 to say their standard of living is improving, but blacks — whose Standard of Living Index score became decidedly more positive after Obama was elected in 2008 — are less likely now that he has left office to say their living standards are getting better. Hispanics’ views are about the same this year as they were in 2016.
Bottom Line
Americans in 2017 are overwhelmingly positive about their standard of living — four in five are satisfied with their situation, and almost two-thirds think it is getting better.
Over the past decade, as the U.S. has recovered from the Great Recession, Americans’ increasingly positive views about their standard of living have provided evidence that the recovery has been slowly but surely making its impact felt across all income levels. The improvement in perceptions of living standards over the past 10 years has generally mirrored a more positive path both for several U.S. economic indicators (unemployment, housing prices and the stock market) and for the public’s perceptions of their own finances and the nation’s economy. This recovery is further underscored by the U.S. Census Bureau’s reporting that the median household income rose 3.2% to just over $59,000 in 2016.
So far this year, most of the improvement in views of living standards can be attributed to a changing political landscape that has seen expectations improve among Republicans more than they have declined among Democrats. Now that those changes have been absorbed into the overall expectations, the months and years ahead will show how much politics will continue to affect expectations and how much the nation’s economic performance will.
SURVEY METHODS
Results are based on telephone interviews conducted Jan. 2, 2008, to Aug. 31, 2017, as part of the Gallup U.S. Daily survey, with a random sample of adults aged 18 and older, living in all 50 U.S. states and the District of Columbia. The national sample size averaged 350,000 in 2008-2010, approximately 175,000 in 2011-2013, approximately 32,000 in 2014-2016 and 21,662 in the first eight months of 2017. In each year since 2013, Gallup has interviewed about 25,000 whites, 3,000 blacks and 3,000 Hispanics. The margin of sampling error for all subgroups is no more than ±3 percentage points. All reported margins of sampling error include computed design effects for weighting.
Each sample of national adults included a minimum quota of 70% cellphone respondents and 30% landline respondents, with additional minimum quotas by time zone within region. Landline and cellular telephone numbers are selected using random-digit-dial methods.
by Jim Norman
Source: Gallup, September 2017

