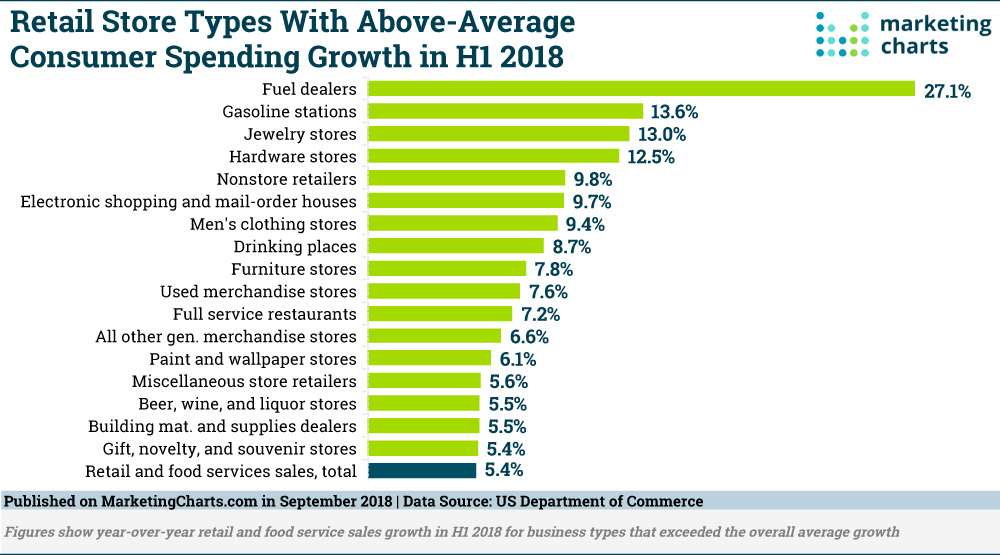
Retail and food service sales grew by 5.35% year-over-year during the first half of 2018, according to unadjusted figures released by the US Department of Commerce. While Americans pulled back their spending at office supplies and stationery stores (-6.7%) and at sporting goods stores (-3%), they appear to be spending more at several types of retailers.
(It’s worth noting that the dismal result for office supplies and stationery stores is in keeping with broader trends. Earlier this year, data from Nielsen revealed that office supplies stores have been some of the hardest hit in terms of closures over the past decade.)
One thing seems for sure: Americans are spending at the pump. During the first half of the year, spending at fuel dealers soared by 27.1%, the biggest jump of any retail store type.
Next up on the list were gasoline stations, with a 13.6% spending hike during H1. When factoring out gasoline stations from the equation, retail sales growth was a slightly more modest 4.6%.
Beyond the pump, it’s been a strong year so far for jewelry stores, which have enjoyed a 13% bump in spending over last year. Hardware stores are also benefiting from spending largesse, as consumers spent 12.5% more at these stores during the January-June period this year than last.
It may be hard to believe, but these store types actually experienced faster growth than e-commerce as a whole! Non-store retailers averaged a 9.8% increase, while electronic shopping and mail-order houses have experienced a 9.7% increase in spending.
Interestingly enough, while apparel shopping is moving online, men’s shopping stores turned in one of the best performances. The 9.4% increase in spending at these stores is almost double the growth in spending at family clothing stores (4.9%), and more than 4 times the spending growth at women’s clothing stores (2%).
Other retail store types seeing faster-than-average spending growth in H1 included:
- Furniture stores (+7.8%);
- Full service restaurants (+7.2%); and
- Beer, wine & liquor stores (+5.5%).
The full list of store types experiencing above-average growth in spend can be seen in the chart above.
Source: Marketing Charts, September 2018

