Author|James Fennessy
Source: www.mediavillage.com, May 2021
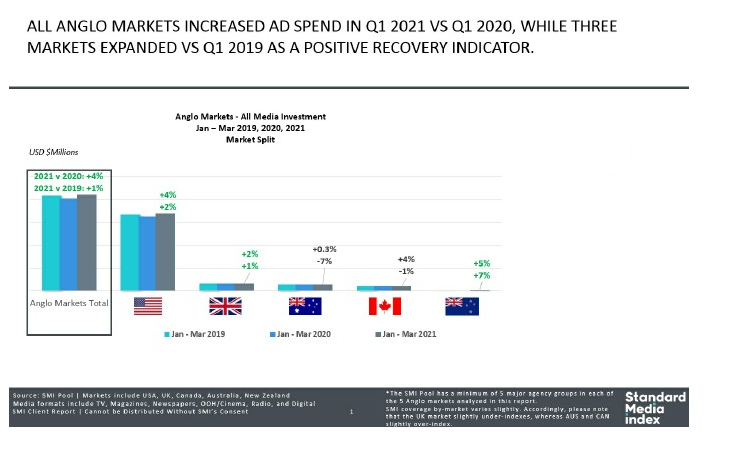
KEY global advertising markets have already begun to recover from 2020’s record declines in ad spend, and our exclusive market intelligence is reporting that the investment by national advertisers in the first quarter of 2021 has grown 1% beyond that achieved in Q1 2019.
Standard Media Index collects and publishes real media agency ad spend, and our data shows a strong rebound in the U.S., U.K., Australian, New Zealand and Canadian markets. In those markets, the combined ad spend has lifted 4% above the total recorded in Q1 2020 and 1% above the pre-COVID Q1 2019 period.
READ MORE
And given the level of economic disruption from the COVID pandemic, it’s phenomenal to see such a positive increase in advertising expenditure back to pre-COVID levels. It clearly highlights the resilience of the advertising industry in these key markets and points to a healthy future for all ad-supported media.
The Q1 results have been boosted by a very strong March result across all markets (+18% in total) after small declines in January and February. But in March strong rebounds in the U.S. and Canada (+22% and +20% respectively) underpinned the global gains, with New Zealand reporting the next highest level of percentage growth (+9%) followed by Australia (+2%) and the U.K. (+0.4%).

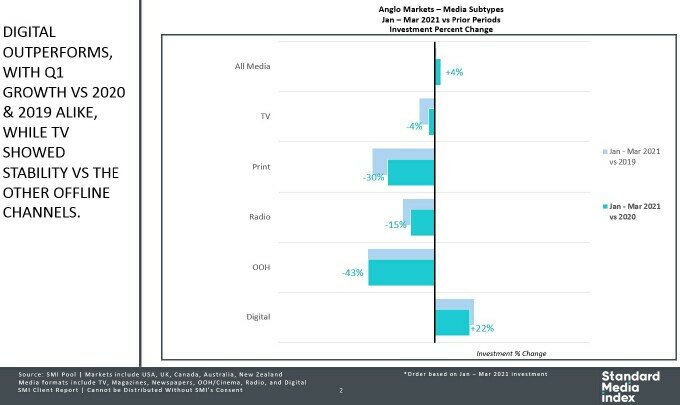
From a media perspective, there was also strong commonality with Digital media emerging as the main growth driver in all markets. The highest growth we’ve seen this quarter is for the Digital media with total investment up 22% on the 2020 numbers as all the key Digital sectors delivered large double digit percentage growth and the highest gains seen in the Programmatic, Social Media and Video Sites sectors. And when compared to the first quarter of 2019 Digital spend has grown an even stronger 25%. Indeed first quarter ad spend for all Digital sectors exceeded the 2019 and 2020 totals in every country.
As a result Digital media’s share of the total advertising pie in these combined markets has grown to 48% of all ad spend which sees it overtakes Television’s share of total spend (at 44%) for the first time and leaving just 7% of ad spend for all other media types.

While most markets reported much stronger growth in Television ad spend in March, softer January and February results meant combined ad spend was back 4% on the Q1 2020 level and back 10% on Q1 2021.
On the negative side the SMI data also showed the impact of COVID on the world’s largest Outdoor media markets was universal, with the collective decline for Q1 still at -43%. In all our markets that Digital and then TV are really the media that are driving the advertising recovery and it’s going to take some time for media more affected by the pandemic – such as Outdoor – to recover. But we’ve seen some positive growth in large Outdoor sectors such as Retail Outdoor so the tide is also turning for this media – it’s just that it may happen more slowly.’
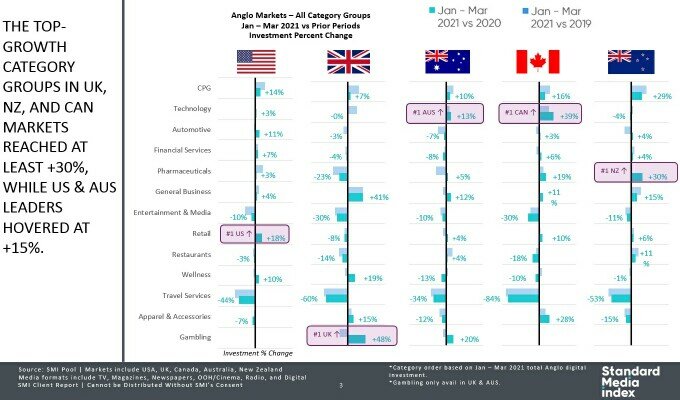
The report also highlighted the large differences seen across markets when it comes to Category ad spend and shows there is little consistency among global marketers.

For example, in the first quarter it was the Government category that delivered the strongest increase in ad spend in Australia while in the US it was the Consumer Electronics market reporting the highest growth; in the UK it was the Gambling category; in Canada advertisers in the Household Supplies market were rapidly growing their media budgets and in NZ the same trend was evident among Utilities advertisers.
 LEARN MORE
SMI’s data again proves that marketers do not assign their global marketing budgets in a blanket fashion, but instead take into account the idiosyncrasies within each market and tailor their spending accordingly.
And as SMI updates this data every month it gives marketers the fastest update of their Category’s varying ad spend trends so they can easily track their share of voice within their Category across all markets and also within the major media within each market.
Click the social buttons above or below to share this content with your friends and colleagues.
The opinions and points of view expressed in this content are exclusively the views of the author and/or subject(s) and do not necessarily represent the views of MediaVillage.com/MyersBizNet, Inc. management or associated writers.

