

During the week of June 13-19, hotels in U.S. markets such as Savannah, Georgia, showed higher demand than in the same week in 2019, according to STR’s Market Recovery Monitor. (Getty Images)
STR
Source: www.costar.com, June 2021
Total US Occupancy Reached 68%, an 85-Week High
For a second consecutive week, U.S. hotel demand was at 90% or more of 2019 levels thanks to leisure travel, according to the latest Market Recovery Monitor from STR, CoStar Group’s hospitality analytics firm.
Room demand for the week of June 13-19 topped 26 million room nights, which was 1 million more rooms sold than the previous week. An average of 3.7 million rooms were sold each day, and for a second consecutive week, demand volume was more than 90% of the level achieved in the corresponding weeks from 2019.
Of course, demand is heavily skewed toward leisure transient as occupancy in hotels that cater to groups and meetings remained weak at 43%, up from 40% the week prior. Occupancy in central business districts ranged from 31% in Minneapolis to 79% in Nashville. Overall, occupancy in central business districts was 53% for the week, well below the national average.
The summer travel surge continued this past week as U.S. hotel occupancy hit an 85-week high at 68%. That is the country’s highest level since the week of November 9, 2019. The turnaround in occupancy is above expectations. At the start of the 2021, occupancy was 38% and has increased each month since.

Full recovery will remain out of reach until group demand returns. Fortunately, there is optimism for a pickup in groups this fall, especially when looking at convention calendars in cities like Chicago, Atlanta and Orlando.
Overall, 72% of all sample hotels posted occupancy above 60%, and large hotels — with more than 300 rooms — achieved 54% occupancy. A total of 37% of all reporting hotels had occupancy at or above 80% in the week. While this is welcomed news, back during the corresponding week in 2019, 48% of hotels reached that level of occupancy. Weekday occupancy was 63%, which was also the highest since November 2019 and indexed at almost 90% of the 2019 level. Weekend occupancy has been hanging around the same level — about 78% — as the comparable 2019 periods for the past month.
Average daily rate continued to climb as well, indexing at 96% of the 2019 level this week. That index is based on non-inflation adjusted average daily rate. Thus, the gap to “normal” average daily rate is a bit wider. Non-inflation adjusted average daily rate for the combined midscale and economy class has been above its 2019 level for the past four weeks. Top 25 market average daily rate has increased for the past nine weeks with Orlando, Miami, Phoenix, San Diego and several others having higher rates this week than in the comparable week of 2019.
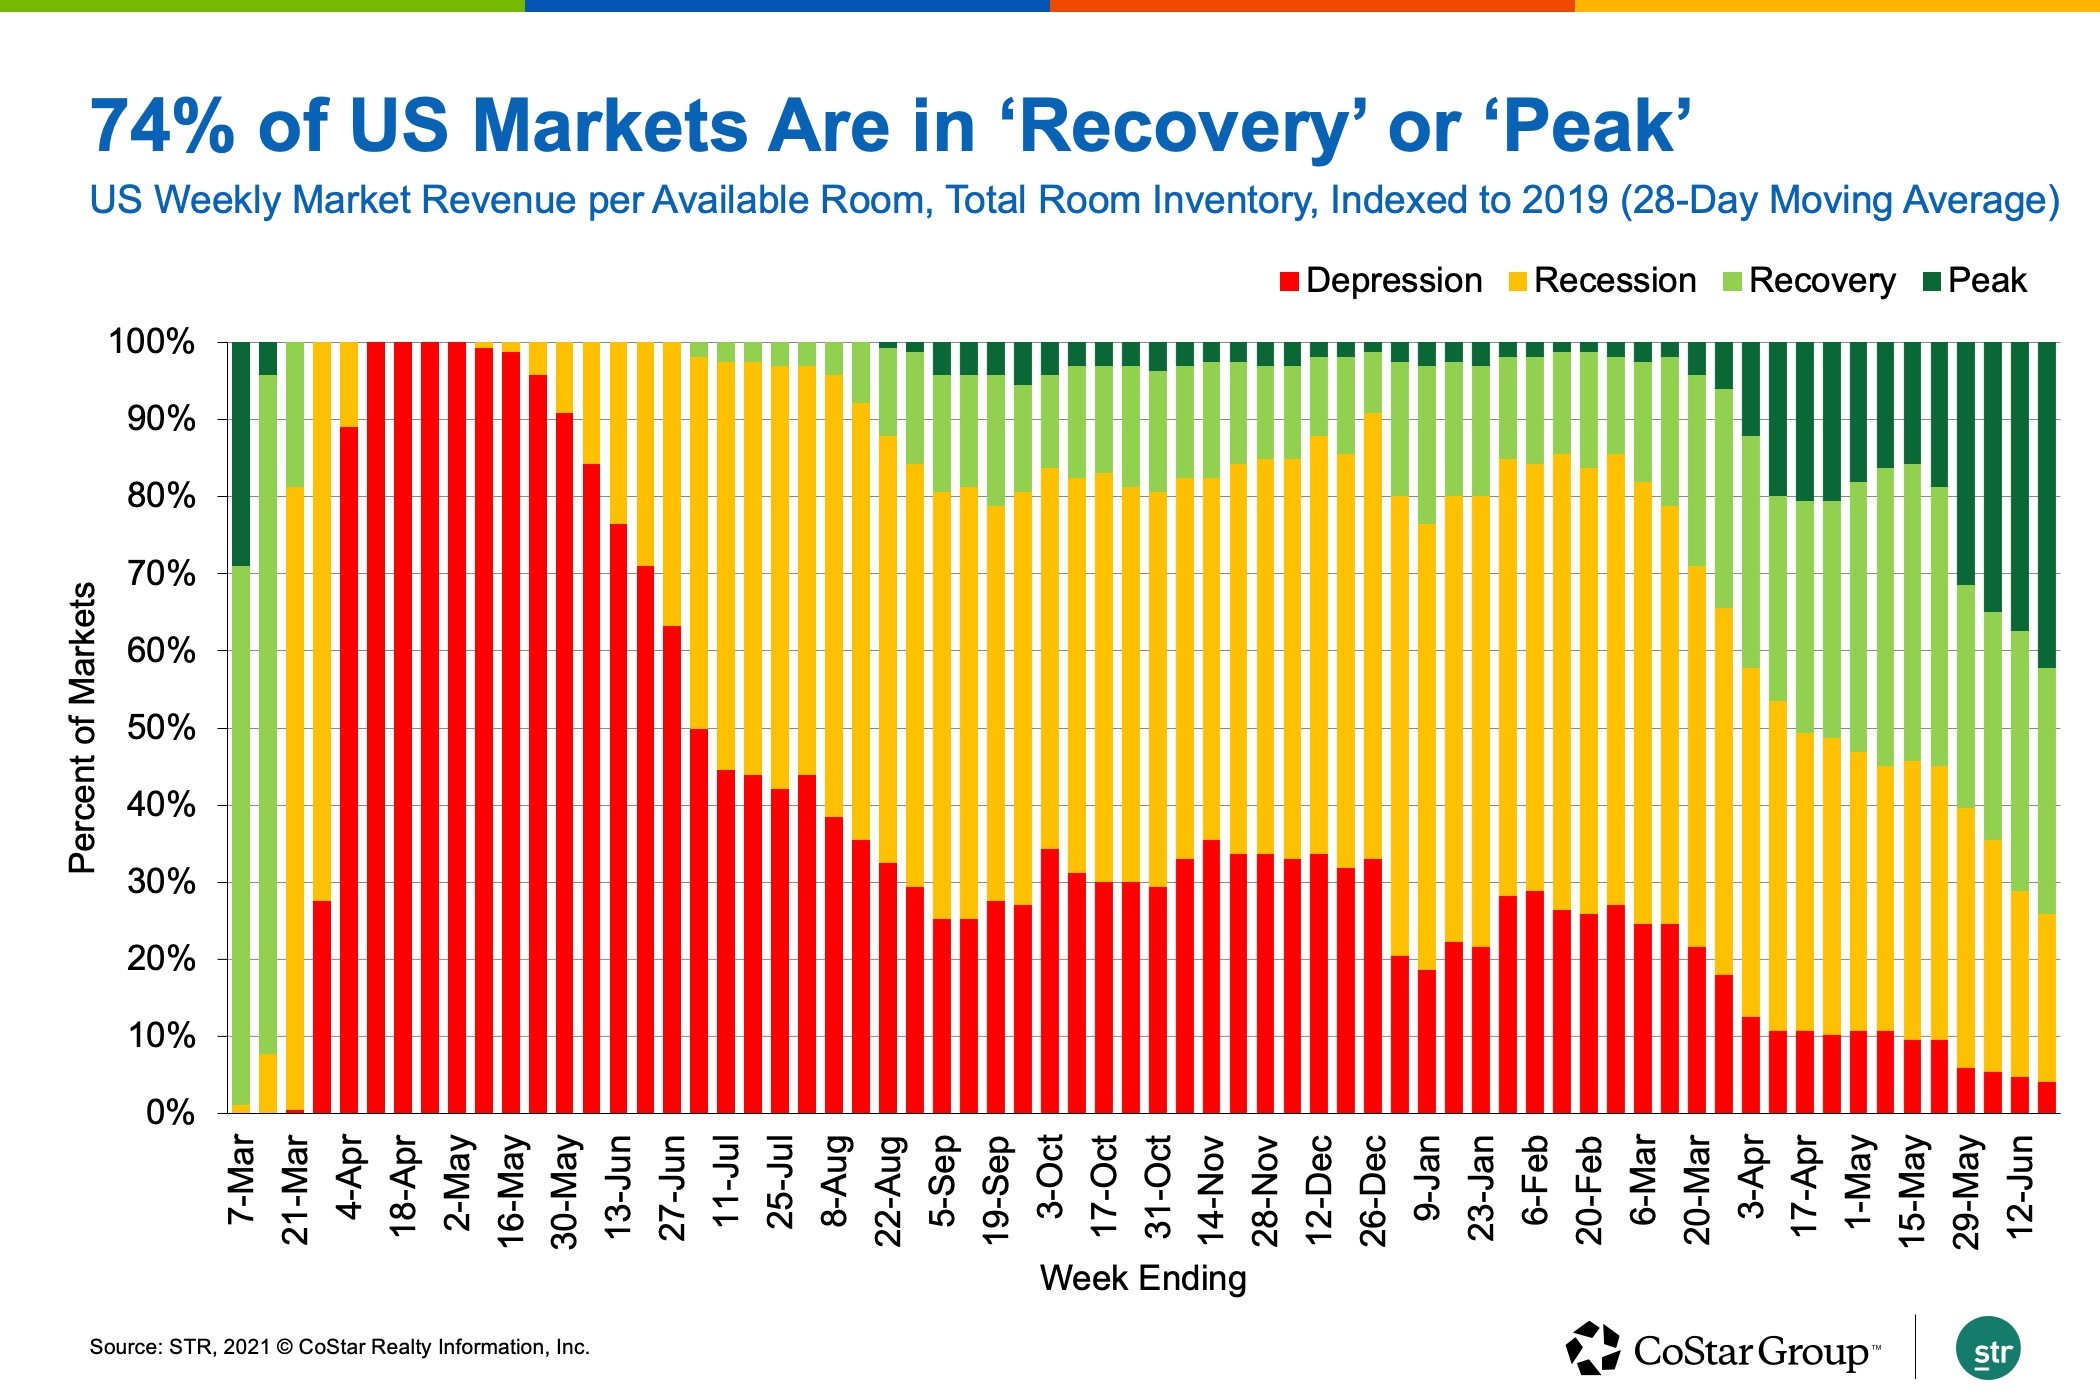
Revenue per available room on a total-room-inventory basis — which accounts for temporarily closed hotels — was $84, reaching its highest level of the pandemic era. Indexed to 2019, revenue per available room was in “recovery” territory — indexing at more than 80% of the 2019 level — for the second straight week as 74% all of markets were in the recovery or peak phases. Peak revenue per available room performance is higher than the level achieved during the comparable week in 2019.

Weekly Performance Highlights
The occupancy increase first began with southern U.S. markets, but this week, the states in the Pacific and Mountain regions posted the largest gains with California leading all states. On a total-room-inventory basis, weekly occupancy was 65%, another pandemic-era high. Since the week ending June 5, occupancy on a total-room-inventory basis increased 5.6 points.
Nearly all states reported demand at 80% or more of their 2019 level, except Illinois, Massachusetts and New York. Hotels in Washington, D.C., also missed that mark.
Ten states, including Tennessee, South Dakota and Utah, had weekly demand higher than what they reported during the comparable week of 2019. At the market level, 54 markets showed higher demand this week than during the same week in 2019, including Savannah, Georgia; Sarasota, Florida; and the Florida Keys. San Francisco and New York City improved with demand at slightly half of what it was in 2019.
Seventy markets had revenue per available room higher than what it was in 2019. Five markets, including Gatlinburg/Pigeon Forge, Tennessee; Palm Beach, Florida; Miami; Sarasota; and the Florida Keys, showed revenue per available room 45% higher than in 2019. Five markets continued to report weekly revenue per available room less than 40% of the 2019 level, including San Francisco, New York City, Boston and Washington, D.C.