Author|Charlene Weisler
Source: www.mediavillage.com, October 2021
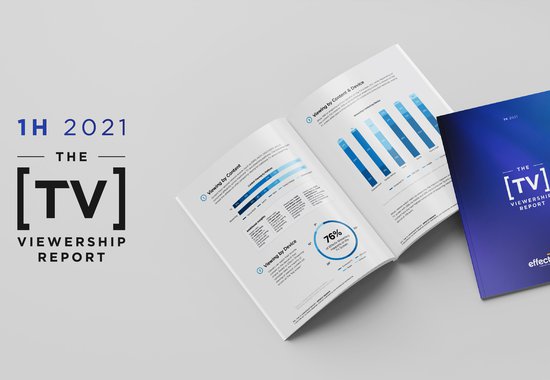
The past 18 months have seen dramatic shifts in media usage as evidenced by the latest TV Viewership Report, which examines the first half of 2021 versus one year ago. We appear to be entering a new era where viewership behaviors continue to be shaped by a range of tumultuous events, and as a result, as the report revealed, “Live viewing grew as a percentage of total time spent with TV. Shifting restrictions on travel and public gatherings likely contribute to both the continuing strength of live TV and shifts in where that content gets consumed.” As in previous studies, the data used in this analysis is from first-party anonymized, aggregated viewership data collected within the Comcast footprint of some 17 million U.S. households. Click here to download the 1H 2021 report.
Among the key findings from the latest study:
- TV Reigns Supreme. The TV screen is still the preferred choice of device for viewers.
“We’ve seen content consumption patterns ebb and flow over the last few years of recorded data. What we have consistently found is that audiences largely have a desire to watch premium video programing on the largest screen available, despite the amount of choice in terms of devices and apps available to stream content.” — John Brauer, Vice President, Insights & Analytics, Effectv
- Streaming Is Important. In fact, according to the aggregated ad exposure data, 76% of streaming consumption is happening on the big screen and can be considered the perfect complement to a TV advertising campaign because of the hard-to-reach audience it attracts. The study revealed that streaming impressions are +209% more likely to be viewed by light or no-TV viewing HHs.
- Cable Is the Top Choice. Overall, Comcast households are spending on average 6 hours and 2 minutes with TV daily while cable TV’s share of TV viewing remains strong at 70% compared to broadcast and premium.
- TV Keeps It Live. Interestingly, the study also found that 88% of all TV viewing happened live throughout the first half of 2021, slightly higher than the same time period last year.
- More Dayparts and More Networks. In terms of dayparts, about 70% of live viewing occurred outside of primetime. The top five networks accounted for only 31% of all viewing in 1H 2021. Overall, Comcast households watched an average of 30 different networks during this period, with 304 different networks achieving “most-watched” status.
“Simply put, when you have more networks in your campaign, you get higher reach among your target audience. Campaigns that are spread across 20 or more networks are optimal and just as the ‘top networks’ in my household are likely Bravo, HGTV and DIY network, another household’s may be completely different. As a result, there are more than 300 ‘most-watched’ networks across measured households.” — Heather Coghill, Senior Director, Audience Insights, Effectv.
Year-to-Year Comparisons
As the nation becomes vaccinated and people yearn to return to a form of normal, it’s not surprising that time spent viewing television naturally would decline. The data supports this, as 1H 2021 had the first year-over-year declines in time spent viewing since data recording began. These declines began in March 2021 and can be attributed to comparisons to 2020 when stay-at-home orders were in place. Interestingly, with viewing still over six hours a day on average, the share of live viewing remains strong and continues to lead against time-shifted viewing throughout the day.
Cable TV continued to command the majority percentage of viewing, increasing its dominance from last year. In 1H 2021, the share of viewing for cable networks gained from 67% share in 1H 2020 to 70% share in 1H 2021 and 71% in 2Q 2021.
Platform Usage Differs by Genre
Consumers also view content differently depending on the platform. Traditional TV is favored for live genres like sports and news, while streaming is favored for young adult, family and entertainment.
However, streaming delivers hard to reach audiences such as cord-cutters and light TV viewers, enabling advertisers to leverage the best of both worlds. In examining more than 20,000 Effectv advertising campaigns in 1H 2021 that included both traditional TV and streaming, it was found that streaming serves as a strong complement to any traditional TV campaign. Notably, more than half (57%) of Effectv streaming reach was incremental to the TV portion of the campaign.
Performance also varied by market. “What this means for advertisers,” the report noted, “is that households watch in different ways in different markets. Investment allocation decisions about traditional TV and streaming must weigh multiple factors including viewing habits, audience segments and geography.”
Conclusion
With each successive viewership report, it is becoming clear that while viewership patterns have shifted and will continue to evolve, there are highly strategic ways that advertisers can use television in all of it various forms. Audiences are in charge and are taking advantage of all the available choices of platforms and devices so they can watch what they want, where and how they want to watch it.
“The latest TV Viewership Report demonstrates linear TV’s ability to reach audiences effectively and efficiently, but it also reinforces the need for advertisers and marketers to utilize streaming to expand reach incrementally.” — John Brauer
Click here to download the 1H 2021 report.
Click the social buttons to share this story with colleagues and friends.
The opinions expressed here are the author’s views and do not necessarily represent the views of MediaVillage.com/MyersBizNet.

