
Latest market research report titled Electronic Musical Instruments Market Growth, Size, Trends, Analysis Report by Type, Application, Region and Segment Forecast 2022-2026 has been announced by Technavio which is proudly partnering with Fortune 500 companies for over 16 years
Technavio Research|Jesse Maida
Source: www.prnewswire.com, August 2022
NEW YORK, Aug. 23, 2022 /PRNewswire/ — One of the trends in the electronic musical instruments market is the continuous development of new products. Vendors have come up with innovative products to remain competitive in the market. For instance, in December 2021, Gibson Brands, Inc. launched Dave Mustaines Flying V-shaped guitar model. Also, in July 2021, Casio launched two new digital pianos in its PX series of digital pianos. Similarly, in September 2019, Roland launched JUPITER-X, a new series of premium synthesizers. In addition, in January 2019, Gibson Brands Inc. (Gibson) announced the launch of a limited-edition Chris Cornell Tribute ES-335 guitar.
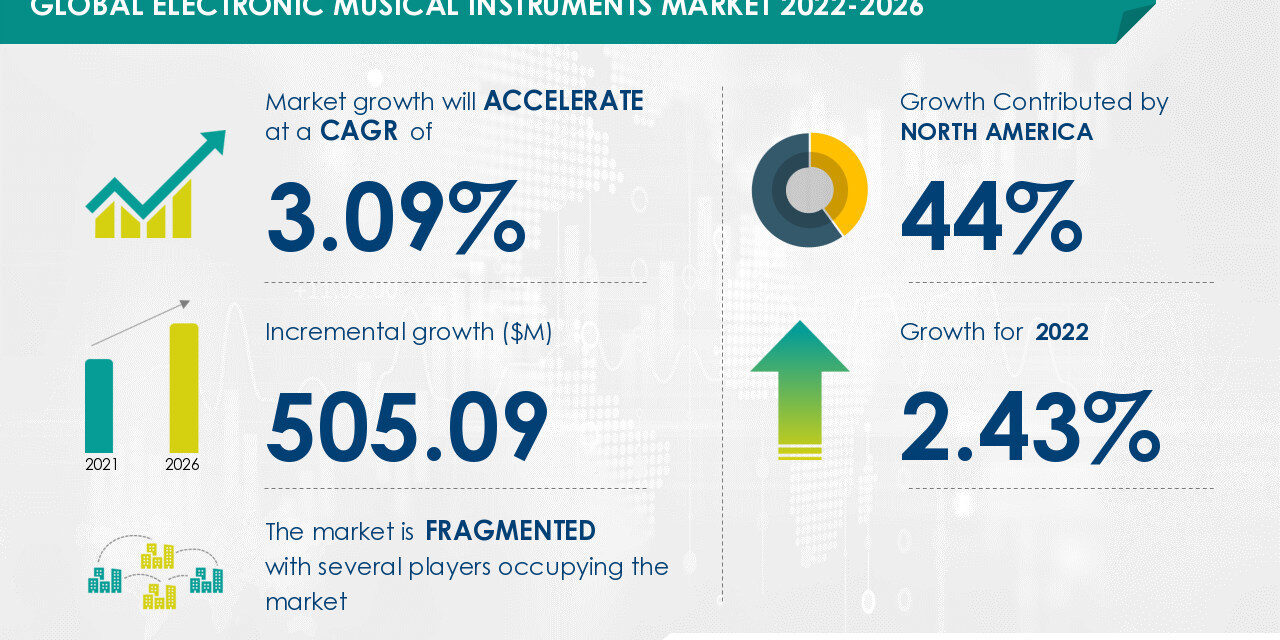
The electronic musical instruments market size is expected to increase by USD 505.09 mn from 2021 to 2026. In addition, the growth momentum of the market will accelerate at a CAGR of 3.09% during the forecast period.
Get a comprehensive report summary describing the market size and forecast along with research methodology. The FREE sample report is available in PDF format
Electronic Musical Instruments Market: Vendor Landscape
Technavio categorizes the global electronic musical instruments market as a part of the global leisure products industry within the global household durables market. The parent market, the global leisure products market, covers a variety of categories, including sports equipment, electronic musical instruments, camping equipment, recreational vehicles, bicycles, toys, and other consumer-oriented games.
Electronic Musical Instruments Market: Market Segmentation
The report on the electronic musical instruments market offers a comprehensive analysis by end-user (electric pianos and keyboards, string instruments, drums and percussion instruments, and others) and geography (North America, Europe, APAC, South America, and the Middle East and Africa).
By end-user, the electric pianos and keyboards segment will contribute the highest market share growth during the forecast period. By geography, North America is expected to occupy 44% of the market share in 2020.
Electronic Musical Instruments Market: Major Growth Drivers
The growing demand for music-related leisure activities is driving the growth of the market. Learning to play electronic musical instruments is gaining popularity among people of all age groups. With the growing disposable income, people are enrolling in music classes. In addition, the number of live music shows is growing rapidly across the world. Moreover, major vendors are introducing innovative music synthesizers. Such factors are expected to fuel the growth of the global electronic musical instruments market during the forecast period.
Make the most of future growth opportunities by being updated with the latest drivers and trends. Download a Free PDF Sample Report Now!
Electronic Musical Instruments Market: Key Vendor Offerings
- Anderson Guitarworks – The company offers electrical musical instruments such as The Classic electric guitar.
- C. F. Martin and Co. Inc. – The company offers electrical musical instruments such as electric guitars.
- CASIO Computer Co. Ltd. – The company offers electrical musical instruments such as Casiotone keyboards.
- Fender Musical Instruments Corp. – The company offers electrical musical instruments such as Mustang electric guitars.
- Focusrite Plc – The company offers electrical musical instruments such as Prophet synthesizers.
Reasons to Buy Electronic Musical Instruments Market Report
- CAGR of the market during the forecast period 2021-2025
- Detailed information on factors that will assist electronic musical instruments market growth during the next five years
- Estimation of the electronic musical instruments market size and its contribution to the parent market
- Predictions on upcoming trends and changes in consumer behavior
- The growth of the electronic musical instruments market across North America, Europe, APAC, South America, and the Middle East and Africa
- Analysis of the market’s competitive landscape and detailed information on vendors
- Comprehensive details of factors that will challenge the growth of electronic musical instruments market vendors
Related Reports
Music and Video Market Growth, Size, Trends, Analysis Report by Type, Application, Region and Segment Forecast 2021-2025
Music Synthesizers Market Growth, Size, Trends, Analysis Report by Type, Application, Region and Segment Forecast 2021-2025
|
Electronic Musical Instruments Market Scope |
|
|
Report Coverage |
Details |
|
Page number |
120 |
|
Base year |
2021 |
|
Forecast period |
2022-2026 |
|
Growth momentum & CAGR |
Accelerate at a CAGR of 3.09% |
|
Market growth 2022-2026 |
USD 505.09 million |
|
Market structure |
Fragmented |
|
YoY growth (%) |
2.43 |
|
Regional analysis |
North America, Europe, APAC, South America, and Middle East and Africa |
|
Performing market contribution |
North America at 44% |
|
Key consumer countries |
US, China, Japan, Germany, and France |
|
Competitive landscape |
Leading companies, competitive strategies, consumer engagement scope |
|
Companies profiled |
Alpher Basses, Anderson Guitarworks, C. F. Martin and Co. Inc., CASIO Computer Co. Ltd., Fender Musical Instruments Corp., Focusrite Plc, Gibson Brands Inc., inMusic Brands Inc., Kawai Musical Instruments Mfg. Co. Ltd., KORG Inc., Marshall Morrison Instruments Pty. Ltd., Music Tribe Global Brands Ltd., Native Instruments GmbH, NS Design, QRS Music Technologies Inc., Rickenbacker International Corp., Roland Corp., Steinway Inc., teenage engineering ab, and Yamaha Corp. |
|
Market Dynamics |
Parent market analysis, market growth inducers and obstacles, fast-growing and slow-growing segment analysis, COVID-19 impact and future consumer dynamics, and market condition analysis for the forecast period. |
|
Customization purview |
If our report has not included the data that you are looking for, you can reach out to our analysts and get segments customized. |
Browse Consumer Discretionary Market Reports
Table of Contents
1 Executive Summary
- 1.1 Market overview
- Exhibit 01: Executive Summary – Chart on Market Overview
- Exhibit 02: Executive Summary – Data Table on Market Overview
- Exhibit 03: Executive Summary – Chart on Global Market Characteristics
- Exhibit 04: Executive Summary – Chart on Market by Geography
- Exhibit 05: Executive Summary – Chart on Market Segmentation by End-user
- Exhibit 06: Executive Summary – Chart on Incremental Growth
- Exhibit 07: Executive Summary – Data Table on Incremental Growth
- Exhibit 08: Executive Summary – Chart on Vendor Market Positioning
2 Market Landscape
- 2.1 Market ecosystem
- Exhibit 09: Parent market
- Exhibit 10: Market Characteristics
3 Market Sizing
- 3.1 Market definition
- Exhibit 11: Offerings of vendors included in the market definition
- 3.2 Market segment analysis
- Exhibit 12: Market segments
- 3.3 Market size 2021
- 3.4 Market outlook: Forecast for 2021-2026
- Exhibit 13: Chart on Global – Market size and forecast 2021-2026 ($ million)
- Exhibit 14: Data Table on Global – Market size and forecast 2021-2026 ($ million)
- Exhibit 15: Chart on Global Market: Year-over-year growth 2021-2026 (%)
- Exhibit 16: Data Table on Global Market: Year-over-year growth 2021-2026 (%)
4 Five Forces Analysis
- 4.1 Five forces summary
- Exhibit 17: Five forces analysis – Comparison between 2021 and 2026
- 4.2 Bargaining power of buyers
- Exhibit 18: Chart on Bargaining power of buyers – Impact of key factors 2021 and 2026
- 4.3 Bargaining power of suppliers
- Exhibit 19: Bargaining power of suppliers – Impact of key factors in 2021 and 2026
- 4.4 Threat of new entrants
- Exhibit 20: Threat of new entrants – Impact of key factors in 2021 and 2026
- 4.5 Threat of substitutes
- Exhibit 21: Threat of substitutes – Impact of key factors in 2021 and 2026
- 4.6 Threat of rivalry
- Exhibit 22: Threat of rivalry – Impact of key factors in 2021 and 2026
- 4.7 Market condition
- Exhibit 23: Chart on Market condition – Five forces 2021 and 2026
5 Market Segmentation by End-user
- 5.1 Market segments
- Exhibit 24: Chart on End-user – Market share 2021-2026 (%)
- Exhibit 25: Data Table on End-user – Market share 2021-2026 (%)
- 5.2 Comparison by End-user
- Exhibit 26: Chart on Comparison by End-user
- Exhibit 27: Data Table on Comparison by End-user
- 5.3 Electric pianos and keyboards – Market size and forecast 2021-2026
- Exhibit 28: Chart on Electric pianos and keyboards – Market size and forecast 2021-2026 ($ million)
- Exhibit 29: Data Table on Electric pianos and keyboards – Market size and forecast 2021-2026 ($ million)
- Exhibit 30: Chart on Electric pianos and keyboards – Year-over-year growth 2021-2026 (%)
- Exhibit 31: Data Table on Electric pianos and keyboards – Year-over-year growth 2021-2026 (%)
- 5.4 String instruments – Market size and forecast 2021-2026
- Exhibit 32: Chart on String instruments – Market size and forecast 2021-2026 ($ million)
- Exhibit 33: Data Table on String instruments – Market size and forecast 2021-2026 ($ million)
- Exhibit 34: Chart on String instruments – Year-over-year growth 2021-2026 (%)
- Exhibit 35: Data Table on String instruments – Year-over-year growth 2021-2026 (%)
- 5.5 Drums and percussion instruments – Market size and forecast 2021-2026
- Exhibit 36: Chart on Drums and percussion instruments – Market size and forecast 2021-2026 ($ million)
- Exhibit 37: Data Table on Drums and percussion instruments – Market size and forecast 2021-2026 ($ million)
- Exhibit 38: Chart on Drums and percussion instruments – Year-over-year growth 2021-2026 (%)
- Exhibit 39: Data Table on Drums and percussion instruments – Year-over-year growth 2021-2026 (%)
- 5.6 Others – Market size and forecast 2021-2026
- Exhibit 40: Chart on Others – Market size and forecast 2021-2026 ($ million)
- Exhibit 41: Data Table on Others – Market size and forecast 2021-2026 ($ million)
- Exhibit 42: Chart on Others – Year-over-year growth 2021-2026 (%)
- Exhibit 43: Data Table on Others – Year-over-year growth 2021-2026 (%)
- 5.7 Market opportunity by End-user
- Exhibit 44: Market opportunity by End-user ($ million)
6 Customer Landscape
- 6.1 Customer landscape overview
- Exhibit 45: Analysis of price sensitivity, lifecycle, customer purchase basket, adoption rates, and purchase criteria
7 Geographic Landscape
- 7.1 Geographic segmentation
- Exhibit 46: Chart on Market share by geography 2021-2026 (%)
- Exhibit 47: Data Table on Market share by geography 2021-2026 (%)
- 7.2 Geographic comparison
- Exhibit 48: Chart on Geographic comparison
- Exhibit 49: Data Table on Geographic comparison
- 7.3 North America – Market size and forecast 2021-2026
- Exhibit 50: Chart on North America – Market size and forecast 2021-2026 ($ million)
- Exhibit 51: Data Table on North America – Market size and forecast 2021-2026 ($ million)
- Exhibit 52: Chart on North America – Year-over-year growth 2021-2026 (%)
- Exhibit 53: Data Table on North America – Year-over-year growth 2021-2026 (%)
- 7.4 Europe – Market size and forecast 2021-2026
- Exhibit 54: Chart on Europe – Market size and forecast 2021-2026 ($ million)
- Exhibit 55: Data Table on Europe – Market size and forecast 2021-2026 ($ million)
- Exhibit 56: Chart on Europe – Year-over-year growth 2021-2026 (%)
- Exhibit 57: Data Table on Europe – Year-over-year growth 2021-2026 (%)
- 7.5 APAC – Market size and forecast 2021-2026
- Exhibit 58: Chart on APAC – Market size and forecast 2021-2026 ($ million)
- Exhibit 59: Data Table on APAC – Market size and forecast 2021-2026 ($ million)
- Exhibit 60: Chart on APAC – Year-over-year growth 2021-2026 (%)
- Exhibit 61: Data Table on APAC – Year-over-year growth 2021-2026 (%)
- 7.6 South America – Market size and forecast 2021-2026
- Exhibit 62: Chart on South America – Market size and forecast 2021-2026 ($ million)
- Exhibit 63: Data Table on South America – Market size and forecast 2021-2026 ($ million)
- Exhibit 64: Chart on South America – Year-over-year growth 2021-2026 (%)
- Exhibit 65: Data Table on South America – Year-over-year growth 2021-2026 (%)
- 7.7 Middle East and Africa – Market size and forecast 2021-2026
- Exhibit 66: Chart on Middle East and Africa – Market size and forecast 2021-2026 ($ million)
- Exhibit 67: Data Table on Middle East and Africa – Market size and forecast 2021-2026 ($ million)
- Exhibit 68: Chart on Middle East and Africa – Year-over-year growth 2021-2026 (%)
- Exhibit 69: Data Table on Middle East and Africa – Year-over-year growth 2021-2026 (%)
- 7.8 US – Market size and forecast 2021-2026
- Exhibit 70: Chart on US – Market size and forecast 2021-2026 ($ million)
- Exhibit 71: Data Table on US – Market size and forecast 2021-2026 ($ million)
- Exhibit 72: Chart on US – Year-over-year growth 2021-2026 (%)
- Exhibit 73: Data Table on US – Year-over-year growth 2021-2026 (%)
- 7.9 China – Market size and forecast 2021-2026
- Exhibit 74: Chart on China – Market size and forecast 2021-2026 ($ million)
- Exhibit 75: Data Table on China – Market size and forecast 2021-2026 ($ million)
- Exhibit 76: Chart on China – Year-over-year growth 2021-2026 (%)
- Exhibit 77: Data Table on China – Year-over-year growth 2021-2026 (%)
- 7.10 Germany – Market size and forecast 2021-2026
- Exhibit 78: Chart on Germany – Market size and forecast 2021-2026 ($ million)
- Exhibit 79: Data Table on Germany – Market size and forecast 2021-2026 ($ million)
- Exhibit 80: Chart on Germany – Year-over-year growth 2021-2026 (%)
- Exhibit 81: Data Table on Germany – Year-over-year growth 2021-2026 (%)
- 7.11 France – Market size and forecast 2021-2026
- Exhibit 82: Chart on France – Market size and forecast 2021-2026 ($ million)
- Exhibit 83: Data Table on France – Market size and forecast 2021-2026 ($ million)
- Exhibit 84: Chart on France – Year-over-year growth 2021-2026 (%)
- Exhibit 85: Data Table on France – Year-over-year growth 2021-2026 (%)
- 7.12 Japan – Market size and forecast 2021-2026
- Exhibit 86: Chart on Japan – Market size and forecast 2021-2026 ($ million)
- Exhibit 87: Data Table on Japan – Market size and forecast 2021-2026 ($ million)
- Exhibit 88: Chart on Japan – Year-over-year growth 2021-2026 (%)
- Exhibit 89: Data Table on Japan – Year-over-year growth 2021-2026 (%)
- 7.13 Market opportunity by geography
- Exhibit 90: Market opportunity by geography ($ million)
8 Drivers, Challenges, and Trends
- 8.1 Market drivers
- 8.2 Market challenges
- 8.3 Impact of drivers and challenges
- Exhibit 91: Impact of drivers and challenges in 2021 and 2026
- 8.4 Market trends
9 Vendor Landscape
- 9.1 Overview
- 9.2 Vendor landscape
- Exhibit 92: Overview on Criticality of inputs and Factors of differentiation
- 9.3 Landscape disruption
- Exhibit 93: Overview on factors of disruption
- 9.4 Industry risks
- Exhibit 94: Impact of key risks on business
10 Vendor Analysis
- 10.1 Vendors covered
- Exhibit 95: Vendors covered
- 10.2 Market positioning of vendors
- Exhibit 96: Matrix on vendor position and classification
- 10.3 Anderson Guitarworks
- Exhibit 97: Anderson Guitarworks – Overview
- Exhibit 98: Anderson Guitarworks – Product / Service
- Exhibit 99: Anderson Guitarworks – Key offerings
- 10.4 C. F. Martin and Co. Inc.
- Exhibit 100: C. F. Martin and Co. Inc. – Overview
- Exhibit 101: C. F. Martin and Co. Inc. – Product / Service
- Exhibit 102: C. F. Martin and Co. Inc. – Key news
- Exhibit 103: C. F. Martin and Co. Inc. – Key offerings
- 10.5 CASIO Computer Co. Ltd.
- Exhibit 104: CASIO Computer Co. Ltd. – Overview
- Exhibit 105: CASIO Computer Co. Ltd. – Business segments
- Exhibit 106: CASIO Computer Co. Ltd. – Key offerings
- Exhibit 107: CASIO Computer Co. Ltd. – Segment focus
- 10.6 Fender Musical Instruments Corp.
- Exhibit 108: Fender Musical Instruments Corp. – Overview
- Exhibit 109: Fender Musical Instruments Corp. – Product / Service
- Exhibit 110: Fender Musical Instruments Corp. – Key news
- Exhibit 111: Fender Musical Instruments Corp. – Key offerings
- 10.7 Focusrite Plc
- Exhibit 112: Focusrite Plc – Overview
- Exhibit 113: Focusrite Plc – Business segments
- Exhibit 114: Focusrite Plc – Key offerings
- Exhibit 115: Focusrite Plc – Segment focus
- 10.8 Gibson Brands Inc.
- Exhibit 116: Gibson Brands Inc. – Overview
- Exhibit 117: Gibson Brands Inc. – Product / Service
- Exhibit 118: Gibson Brands Inc. – Key news
- Exhibit 119: Gibson Brands Inc. – Key offerings
- 10.9 inMusic Brands Inc.
- Exhibit 120: inMusic Brands Inc. – Overview
- Exhibit 121: inMusic Brands Inc. – Product / Service
- Exhibit 122: inMusic Brands Inc. – Key offerings
- 10.10 Kawai Musical Instruments Mfg. Co. Ltd.
- Exhibit 123: Kawai Musical Instruments Mfg. Co. Ltd. – Overview
- Exhibit 124: Kawai Musical Instruments Mfg. Co. Ltd. – Product / Service
- Exhibit 125: Kawai Musical Instruments Mfg. Co. Ltd. – Key offerings
- 10.11 KORG Inc.
- Exhibit 126: KORG Inc. – Overview
- Exhibit 127: KORG Inc. – Product / Service
- Exhibit 128: KORG Inc. – Key offerings
- 10.12 Marshall Morrison Instruments Pty. Ltd.
- Exhibit 129: Marshall Morrison Instruments Pty. Ltd. – Overview
- Exhibit 130: Marshall Morrison Instruments Pty. Ltd. – Product / Service
- Exhibit 131: Marshall Morrison Instruments Pty. Ltd. – Key offerings
11 Appendix
- 11.1 Scope of the report
- 11.2 Inclusions and exclusions checklist
- Exhibit 132: Inclusions checklist
- Exhibit 133: Exclusions checklist
- 11.3 Currency conversion rates for US$
- Exhibit 134: Currency conversion rates for US$
- 11.4 Research methodology
- Exhibit 135: Research methodology
- Exhibit 136: Validation techniques employed for market sizing
- Exhibit 137: Information sources
- 11.5 List of abbreviations
- Exhibit 138: List of abbreviations
About Us
Technavio is a leading global technology research and advisory company. Their research and analysis focus on emerging market trends and provide actionable insights to help businesses identify market opportunities and develop effective strategies to optimize their market positions. With over 500 specialized analysts, Technavio’s report library consists of more than 17,000 reports and counting, covering 800 technologies, spanning across 50 countries. Their client base consists of enterprises of all sizes, including more than 100 Fortune 500 companies. This growing client base relies on Technavio’s comprehensive coverage, extensive research, and actionable market insights to identify opportunities in existing and potential markets and assess their competitive positions within changing market scenarios.
Contact
Technavio Research
Jesse Maida
Media & Marketing Executive
US: +1 844 364 1100
UK: +44 203 893 3200
Email: media@technavio.com
Website: www.technavio.com/