“Spending hasn’t changed much over the past few years, but we are seeing a noticeable increase in consumers whose Halloween purchases are inspired by their friends, neighbors and even celebrities on social media.”
Shoppers say they will spend an average $86.27, down just slightly from last year’s record $86.79. That works out to $8.8 billion in total spending, down from last year’s $9 billion. This year’s total is expected to be the third-highest in the survey’s 15-year history, after the record $9.1 billion set in 2017. A total of 172 million people plan to celebrate Halloween – 68 percent of those surveyed – down from 175 million last year.
“Spending hasn’t changed much over the past few years, but we are seeing a noticeable increase in consumers whose Halloween purchases are inspired by their friends, neighbors and even celebrities on social media,” NRF President and CEO Matthew Shay said. “Retailers expect to have another strong Halloween season and have stocked up on candy, decorations and the season’s most popular costumes.”
Online search remains the top source of Halloween inspiration, cited by 35 percent of consumers surveyed, followed by browsing in stores at 28 percent, and ideas from friends and family at 20 percent. Inspiration from social media has increased across several platforms since 2015. Pinterest was cited by 18 percent, up from 13 percent in 2015; 14 percent cited both YouTube (up from 8 percent) and Instagram (up from 7 percent).
Men and women prefer different social media channels for Halloween inspiration. Pinterest was the choice of 25 percent of women but only 12 percent of men, while YouTube was cited by 19 percent of men and only 10 percent of women. Instagram was almost evenly split at 15 percent of men and 14 percent of women.
According to the survey, consumers plan to spend $3.2 billion on costumes (purchased by 67 percent of Halloween shoppers), $2.6 billion on candy (95 percent), $2.7 billion on decorations (72 percent) and $390 million on greeting cards (34 percent).
Among those celebrating, 69 percent plan to hand out candy, 49 percent plan to decorate their home or yard, 47 percent will dress in costume, 44 percent will carve a pumpkin, 32 percent will throw or attend a party, 29 percent will take their children trick-or-treating, 22 percent will visit a haunted house and 17 percent will dress their pets in costume.
To buy Halloween merchandise, 42 percent of shoppers will go to a discount store, 36 percent to a specialty Halloween or costume store, 25 percent will shop online, another 25 percent will go to a grocery store and 23 percent will visit a department store.
The ongoing trade war with China is causing uncertainty among American consumers, and 14 percent of those surveyed said their concerns about the economy would impact their Halloween plans. Most Halloween merchandise was in the country before 15 percent tariffs on consumer goods took effect September 1.
Top Costumes
“Halloween celebrations are primarily for children, and we see many of the same costume choices year after year,” Prosper Insights Executive Vice President for Strategy Phil Rist said. “Grownups who celebrate may be looking for new ideas, but for children, princesses and superheroes are perennial favorites.”
Children
The survey found 3.1 million children plan to dress up as their favorite princess, 2.4 million as their favorite superhero, 2 million as Spider-Man,1.5 million as an Avengers character other than Spider-Man and 1.4 million as Batman.
- Princess – 7.9 percent
- Superhero – 6 percent
- Spider-Man – 5.2 percent
- Avengers character (excluding Spider-Man) – 3.9 percent
- Batman – 3.5 percent
- Witch – 3.3 percent
- Ghost – 2.8 percent
- Vampire – 2.2 percent
- Frozen (Elsa, Anna) – 2.2 percent
- Pirate – 2.1 percent
Adults
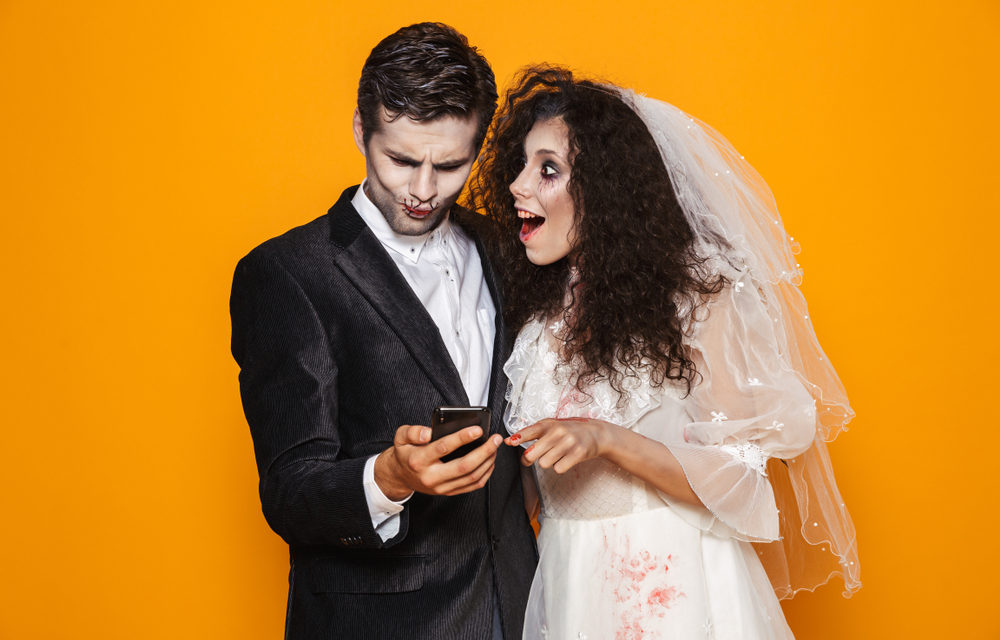
The survey found 5 million adults plan to dress like a witch, 2 million as a vampire, 1.8 million as a superhero, 1.5 million as a pirate and 1.4 million as a zombie.
- Witch – 8.9 percent
- Vampire – 3.6 percent
- Superhero – 3.1 percent
- Pirate – 2.7 percent
- Zombie – 2.5 percent
- Ghost – 2 percent
- Avengers character (excluding Spider-Man) – 2 percent
- Princess – 1.9 percent
- Cat – 1.8 percent
- Spider-Man – 1.7 percent
Pets
The survey found that 29 million people plan to dress their pets in costume for Halloween.
- Pumpkin – 9.3 percent
- Hot dog – 7.2 percent
- Superhero – 7.2 percent
- Bumble Bee – 3.9 percent
- Cat – 3.2 percent
- Witch – 2.5 percent
- Lion – 2.2 percent
- Dog – 2.1 percent
- Devil – 2 percent
- Shark – 1.7 percent
The survey of 7,419 consumers was conducted September 3-10 and has a margin of error of plus or minus 1.2 percentage points.
About NRF
The National Retail Federation, the world’s largest retail trade association, passionately advocates for the people, brands, policies and ideas that help retail thrive. From its headquarters in Washington, D.C., NRF empowers the industry that powers the economy. Retail is the nation’s largest private-sector employer, contributing $2.6 trillion to annual GDP and supporting one in four U.S. jobs — 42 million working Americans. For over a century, NRF has been a voice for every retailer and every retail job, educating, inspiring and communicating the powerful impact retail has on local communities and global economies.
About Prosper Insights & Analytics
Prosper Insights & Analytics is a global leader in consumer intent data serving the financial services, marketing technology, and retail industries. We provide global authoritative market information on U.S. and China consumers via curated insights and analytics. By integrating a variety of data including economic, behavioral and attitudinal data, Prosper helps companies accurately predict consumers’ future behavior to help identify market behaviors, optimize marketing efforts, and improve the effectiveness of demand generation campaigns. www.ProsperInsights.com

